Background
As I mentioned in a previous post – this is the second graph from my replication of The Economist graphs. I have discovered that not all of the data/visuals within the Economist come from free sources, nor provide extensive details around any sort of “author’s calculations.” This greatly reduces the reproducibility of a number of my favorite and insightful charts from each issue. With that said, I spent some extra time attempting to re-create the feature article within January 2017 - Week 2. Fortunately, I was familiar with the source of data since I have previously built wordclouds based on State of the Union Speeches (or SOTUS for the beltway crowd).
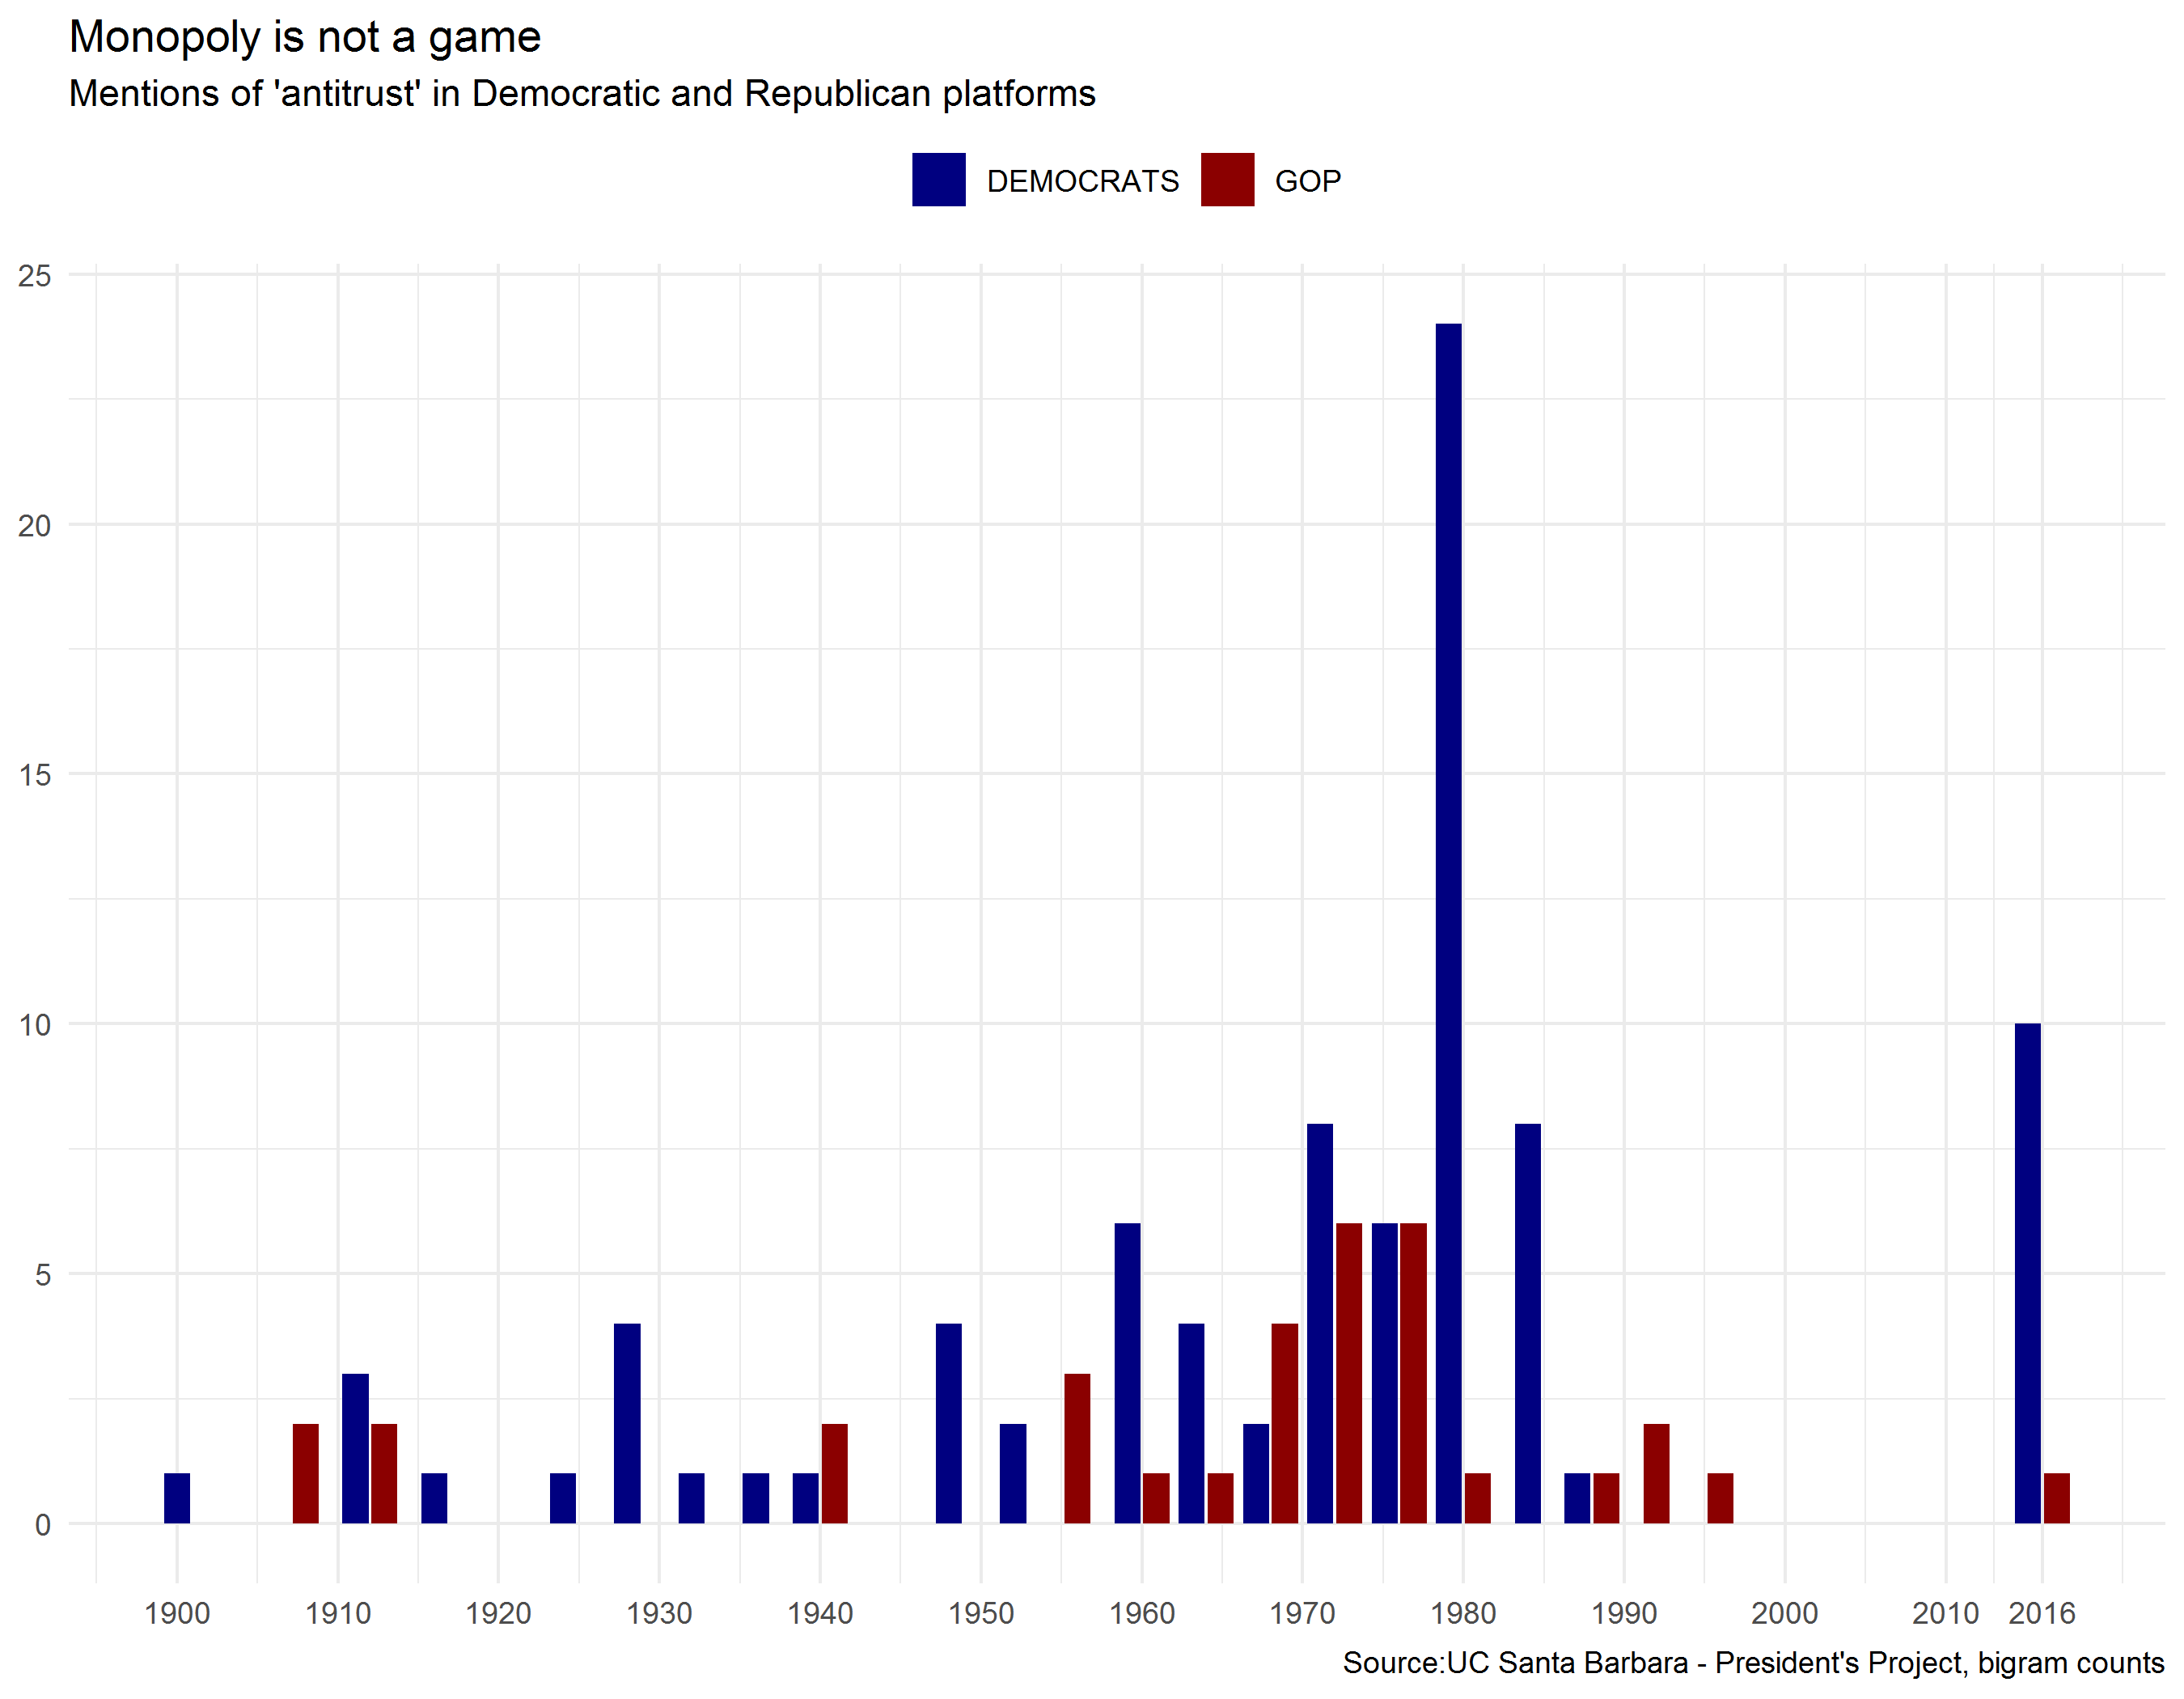
This post takes political party platform data to evaluate the diminishing mentions of Anti-Trust. Since this analysis is somewhat data intensive, I am not going to host all of the information, but I’ll try to provide enough documentation for others to re-create the visual.
Magazine Details
January 2017 - Week 2
Issue Title: The New Titan’s and How to Tame Them
Article Title: Coping with Techlash
Graph Title: Monopoly is not a game
Article Page Number: 19
Data Details
Data Source: UC Santa Barbara, Presidents Project
Data Base Link: Here
Data Category: U.S. Politics
About the Data
If you are not familiar with the UC Santa Barbara, Presidents Project and are a fan of politics – you should definitely visit the site. The number of documents and dedication to cataloging is incredibly impressive and seamless to search through. The organization also does their own great bit of analysis with the data as well.
We will focus on the National Political Party platforms that have been catalogued by the non-profit.
pks <- c("tidyverse", "purrr", "tools", "fs", "lubridate",
         "stringr", "readxl", "ggthemes", "tidytext", "rvest")


invisible(lapply(pks, require, character.only = T))
Getting the Data
As I mentioned, I will not be executing the code below – however, this provides how the data can be quickly downloaded locally for replicating/further analysis.
# HTML Table with links to party platform

base_url <- "https://www.presidency.ucsb.edu/documents/presidential-documents-archive-guidebook/national-political-party-platforms"

# xpath of the table to get all permalinks of platform text
site_xpath <- "//*[@id='block-system-main']/div/div/div/div[2]/table"

set_col_nms <- c("dt_yr", "party", "nominee", "electoral_votes", "word_cnt")

# Get text from tables so we know what is contained within the links
d_txt_full <- read_html(base_url)%>%
  html_nodes(xpath = site_xpath)%>%
  html_table(fill=T)%>%
  .[[1]]%>%
  .[-1, -3]

# Capture notes from data, then we will remove them once we have
# them stored in another object
d_notes <- d_txt_full[nrow(d_txt_full), ]

# Identify which rows have years so we can remove unnecessary rows
# (and have clean numeric years)
d_txt_clean <- d_txt_full%>%
  .[-nrow(.),]%>%
  setNames(., set_col_nms)%>%
  mutate(row_remove = if_else(str_length(dt_yr) > 2, 0, 1),
         word_cnt = as.numeric(str_replace_all(word_cnt, pattern="[^0-9]", "")))%>%
  filter(row_remove == 0)%>%
  select(-row_remove)

# Create a dataframe with two columns:
# Col1 = All of the links
# Col2 = The text
d_url_full <- bind_cols(
  read_html(base_url)%>%
    html_nodes(xpath = site_xpath)%>%
    html_nodes("a")%>%
    html_attr("href")%>%
    as_tibble(),
  read_html(base_url)%>%
    html_nodes(xpath = site_xpath)%>%
    html_nodes("a")%>%
    html_text()%>%
    as_tibble)%>%
  setNames(., c("txt_url", "format"))%>%
  filter(format != "pdf")%>%
  mutate(format = paste0(format,"-HTML"))

# Combine notes and references within a single dataframe
d_notes <- bind_cols(d_notes, d_url_full[nrow(d_url_full), ])

# Create a dataframe with url for dloading, party name and year
# of platform
d_ref_txt <- bind_cols(d_txt_clean, d_url_full[-nrow(d_url_full), ])

# Loop through the datafram we just created in order to
# download all of the text from the site urls and save the files
# with National party name (e.g. Dem v. GOP) and year

for(i in seq(nrow(d_ref_txt))){

  text <- read_html(d_ref_txt$txt_url[i])%>%
  html_nodes(xpath = "//*[@id='block-system-main']/div/div/div[1]/div[3]") %>% # isloate the text
  html_text() # get the text

  fname <- paste0(d_ref_txt$dt_yr[i], d_ref_txt$party[i], "-",
                  str_replace_all(d_ref_txt$nominee[i],pattern=" ", ""), ".txt")

  sink(file = fname) %>% # open file to write
    cat(text)  # write the file
  sink() # close the file
}
Load and Clean Data
Now that we have all of the text for each party, for each year – we can load the text in for analysis.
# the directory where you downloaded all of the text files
wd_txt <- paste0(getwd(), "YOUR DIRECTORY HERE")

# Get file names
f_gop <- dir_ls(wd_txt, regexp = "Repub")
f_dem <- dir_ls(wd_txt, regexp = "Demo")

# Load data into R environment
d_txt_full <- bind_rows(f_gop%>%
                          map_chr(~read_file(.))%>%
                          data_frame(text = .)%>%
                          mutate(party = "GOP",
                                 dt_yr = as.numeric(str_sub(basename(f_gop), 0,4))),
                        f_dem%>%
                          map_chr(~read_file(.))%>%
                          data_frame(text = .)%>%
                          mutate(party = "DEMOCRATS",
                                dt_yr = as.numeric(str_sub(basename(f_dem), 0,4))))
Cleaning Steps
For some of the language used here, refer to the free online book for Text Mining in R with the package tidytext (link)
- Get all of the file names within the direcotry by party
- Load all of the text files by party, creating a new column representing which party and year
- Bind the data together by rows so all of the text is in a single dataframe
- Once we have the data, we need to create unique rows for “bigrams” or by each two consecutive words within the text
- Finally, we need to clean the search word we’re interested in (Anti-Trust). With any text analysis, there is some ambiguity about locating all of the references.
For example, it could be Anti-Trust, anti trust, antitrust or something evermore vague like the Sherman Act (the primary statute implementing Anti-Trust laws)
Aggregation Steps
- Once we have our “bigrams” with antitrust, we need to group them by party and year, in order to get a frequency of use.
d_bigram <- d_txt_full%>%
  unnest_tokens(bigram, text, token = "ngrams", n = 2)%>%
  group_by(bigram, party, dt_yr)%>%
  summarize(bigram_cnt = n())%>%
  arrange(desc(bigram_cnt))%>%
  ungroup()

d_at_bigrams <- d_bigram%>%
  mutate(bigram_trim = str_replace_all(bigram, pattern = " ", ""))%>%
  filter(grepl(bigram_trim, pattern = "antitrust", ignore.case = T))

d_bigram_sub <- d_bigram%>%
  mutate(bigram_trim = str_replace_all(bigram, pattern = " ", ""))%>%
  filter(grepl(bigram_trim, pattern = "antitrust", ignore.case = T))%>%
  group_by(dt_yr, party)%>%
  summarize(grp_cnt = sum(bigram_cnt, na.rm = T))%>%
  ungroup()%>%
  mutate(dt_full = as.Date(paste(dt_yr, "01", "01", sep = "-")))%>%
  arrange(dt_yr, party)
Plot Data
We will create a time-series barplot based on the number of bigrams using the term Anti-Trust within each parties platform text.
p1 <- ggplot(d_bigram_sub, aes(x = dt_yr, y = grp_cnt, fill = party, group = party)) +
    geom_bar(stat = "identity", position = position_dodge2(width = 0.9, preserve = "single")) +
    scale_fill_manual(values = c("navy", "darkred"), name = NULL) + scale_x_continuous(breaks = c(seq(1900,
    2010, 10), 2016)) + labs(title = "Monopoly is not a game", subtitle = "Mentions of 'antitrust' in Democratic and Republican platforms",
    x = NULL, y = NULL, caption = "Source:UC Santa Barbara - President's Project, bigram counts") +
    theme_minimal() + theme(legend.position = "top")


ggsave("Political-Platform-Use-of-Antitrust.png", p1, width = 9, height = 7,
    bg = "transparent")