The Federal Housing Administration is an agency within HUD that provides a federal guarantee (endorsement), for loans originated in the primary marketplace. Each month, the agency publishes a monthly snapshot, for purposes of demonstrating the lenders, mortgage type, geography and financing terms for mortgages it ensures.
For purposes of this exercise, all of the data has already been downloaded locally, transformed and saved for purposes of loading directly into R for visualization. A detailed file of that process can be found here.
options(stringsAsFactors = F, scipen = 99)

# List packages used
pks <- c("rvest", "ggplot2", "purrr", "tidyverse", "tidycensus",
         "stringr", "lubridate", "fs", "knitr", "xlsx", "readxl", "scales")

# Load packages used
invisible(lapply(pks, require, character.only = T))

##################################################
# NOTE                                          #
# This will need to be updated by the user      #
# depending on where the data they dl is stored #
##################################################

main_dir <- paste0(path_home_r(), "/R/2018/FHA-Orig/")
data_dir <- paste0(main_dir, "data/")
Read-in Data that Has Already Been Downloaded
We will use the function created above to download the single .csv file stored locally containing all of the data produced by FHA from January 18 - August 18.
fha_ref_url <- "https://raw.githubusercontent.com/stuartiquinn/datasets/master/fha_originations/ref_file/1_ref_var_definitions.csv"
d_ref_col_nms <- read_csv(fha_ref_url)
fname <- dir_ls(main_dir, regexp = "FHA-Orig-2018")
d_full <- read.csv(fname, header = T)
# Set colnames with the reference file
colnames(d_full) <- d_ref_col_nms$var_name
d_full <- d_full%>%
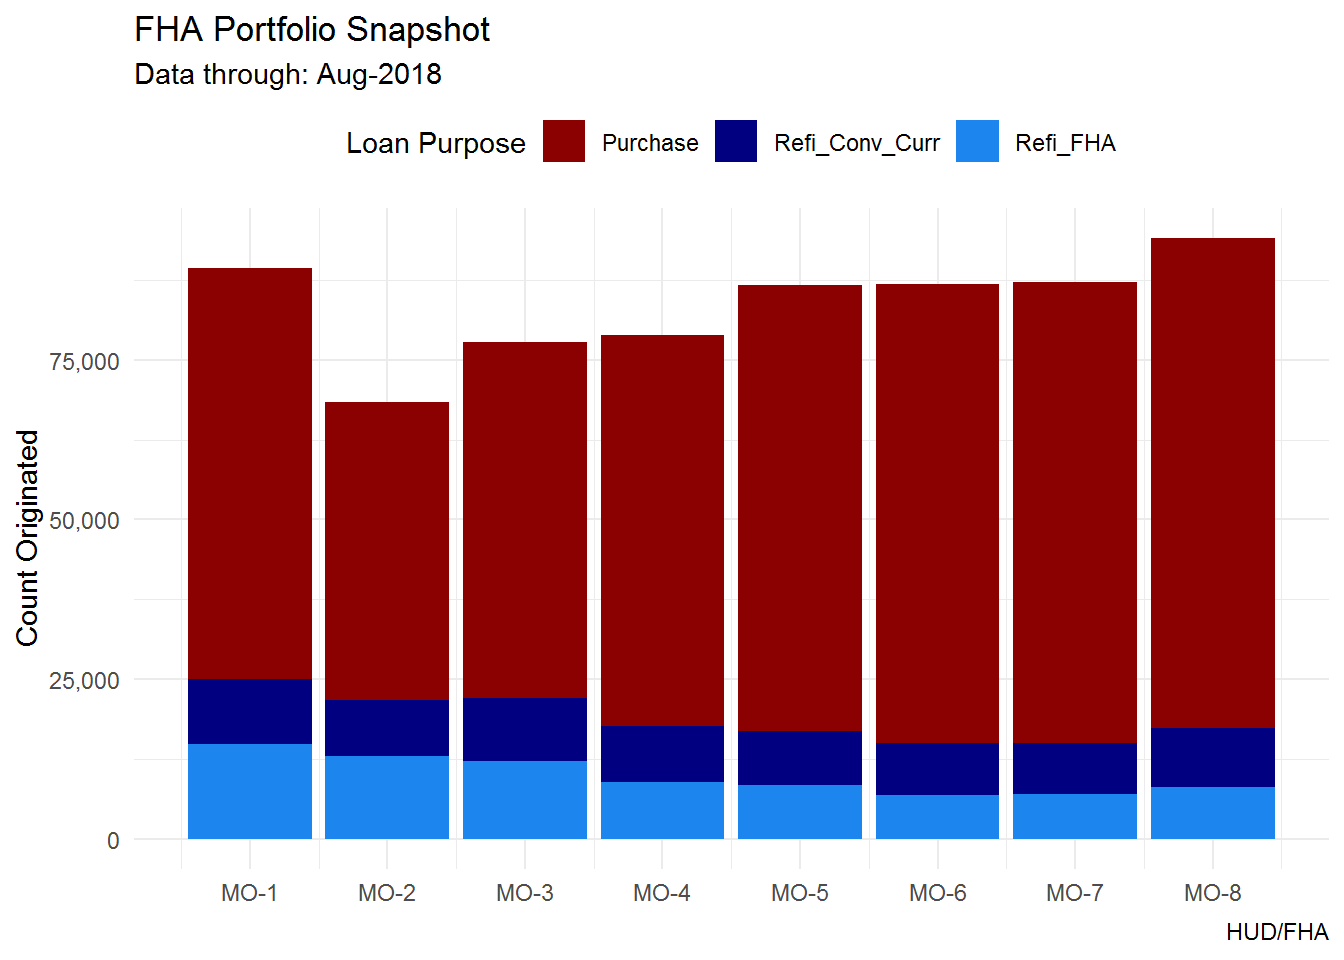
arrange(dt_yr_endorse, dt_mo_endorse)ggplot(d_full, aes(x = dt_mo_endorse, fill = loan_purpose, group = loan_purpose))+
geom_bar(stat = "count")+
scale_fill_manual(values = c("darkred", "navy", "dodgerblue2"), "Loan Purpose")+
scale_y_continuous(label = comma)+
scale_x_continuous(breaks = c(seq(min(d_full$dt_mo_endorse), max(d_full$dt_mo_endorse), 1)),
label = function(x) paste0("MO-", x))+
labs(title = "FHA Portfolio Snapshot",
subtitle = paste0("Data through: ", month.abb[max(d_full$dt_mo_endorse)],
"-", max(d_full$dt_yr_endorse)),
caption = "HUD/FHA",
x = NULL,
y = "Count Originated")+
theme_minimal()+
theme(legend.position = "top")